

Market Report · October 2026
Denver Market Snapshot: September 2026
Closed sales hit a September low not seen since 2008, but prices held steady. Rates climbed to about 7.5%, and seller-paid rate buydowns are now a standard part of the deal. Here's what the September numbers say.
Data current as of September 2026. Sources: West + Main Homes, Denver Metro MLS; DMAR Market Trends Report.
Denver Metro at a Glance: September 2026
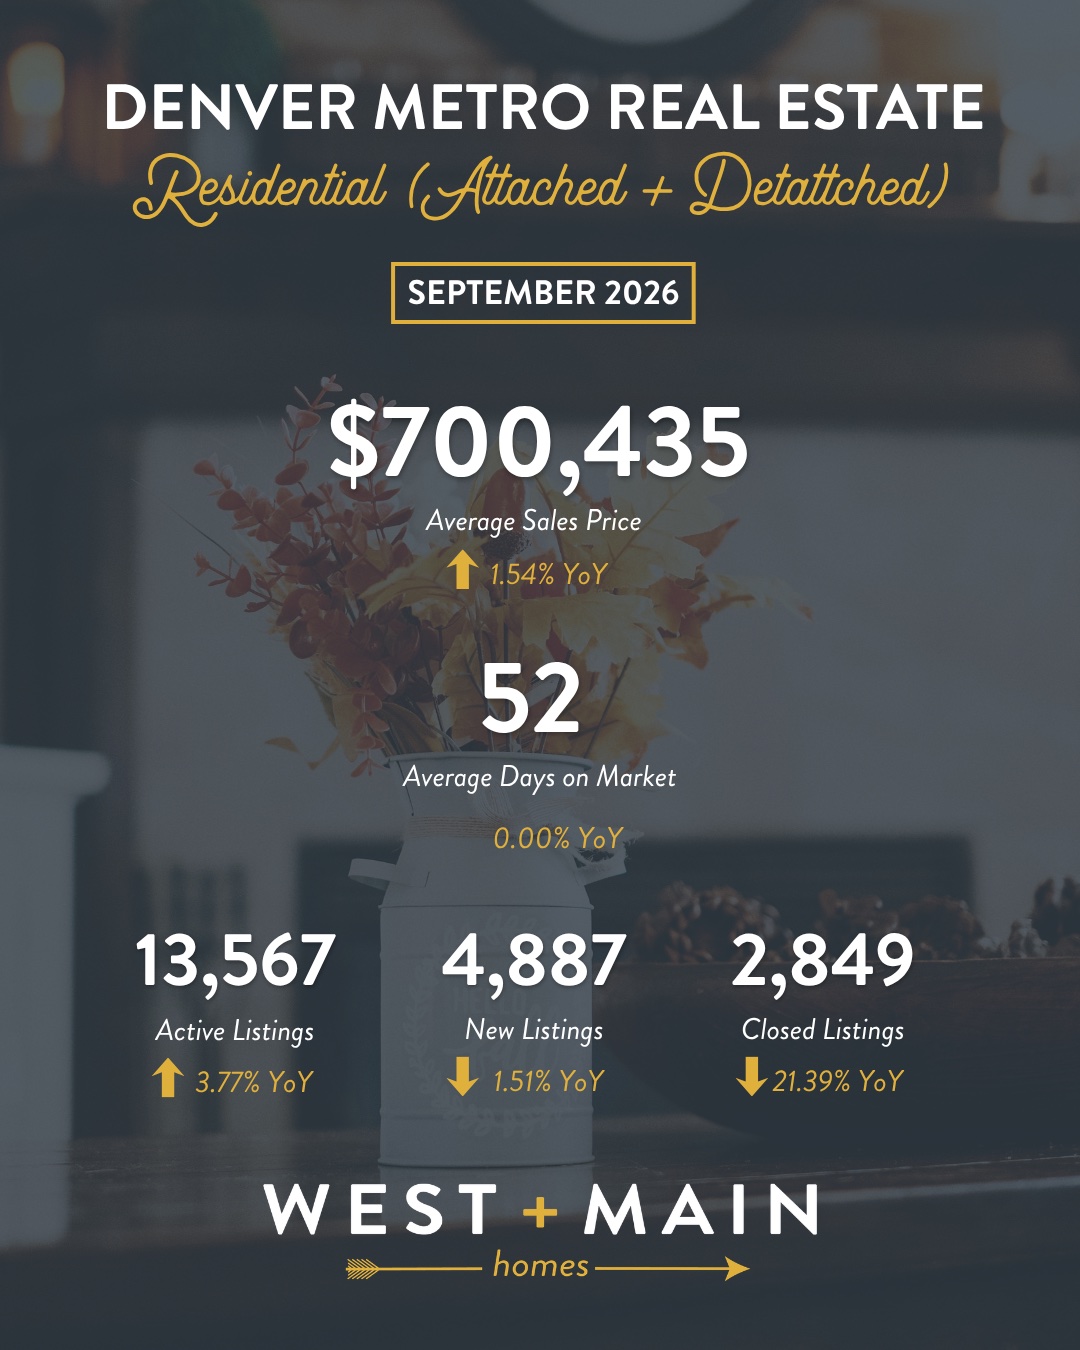
All residential properties (attached + detached combined):
| Metric | September 2026 | Year-over-Year |
|---|---|---|
| Average Sales Price | $700,435 | +1.54% |
| Average Days on Market | 52 days | 0.00% |
| Active Listings | 13,567 | +3.77% |
| New Listings | 4,887 | -1.51% |
| Closed Sales | 2,849 | -21.39% |
A few more figures from DMAR's September report:
- Close-price-to-list-price ratio: 98.45%, up from 98.32% last September.
- Months of inventory: 4.76 overall, and 7.21 for condos and townhomes.
- Pending sales: 2,908, down 6.07% from August.
By Property Type
| Property Type | Avg Sale Price | YoY | Avg Days on Market | YoY | Closed Sales | YoY |
|---|---|---|---|---|---|---|
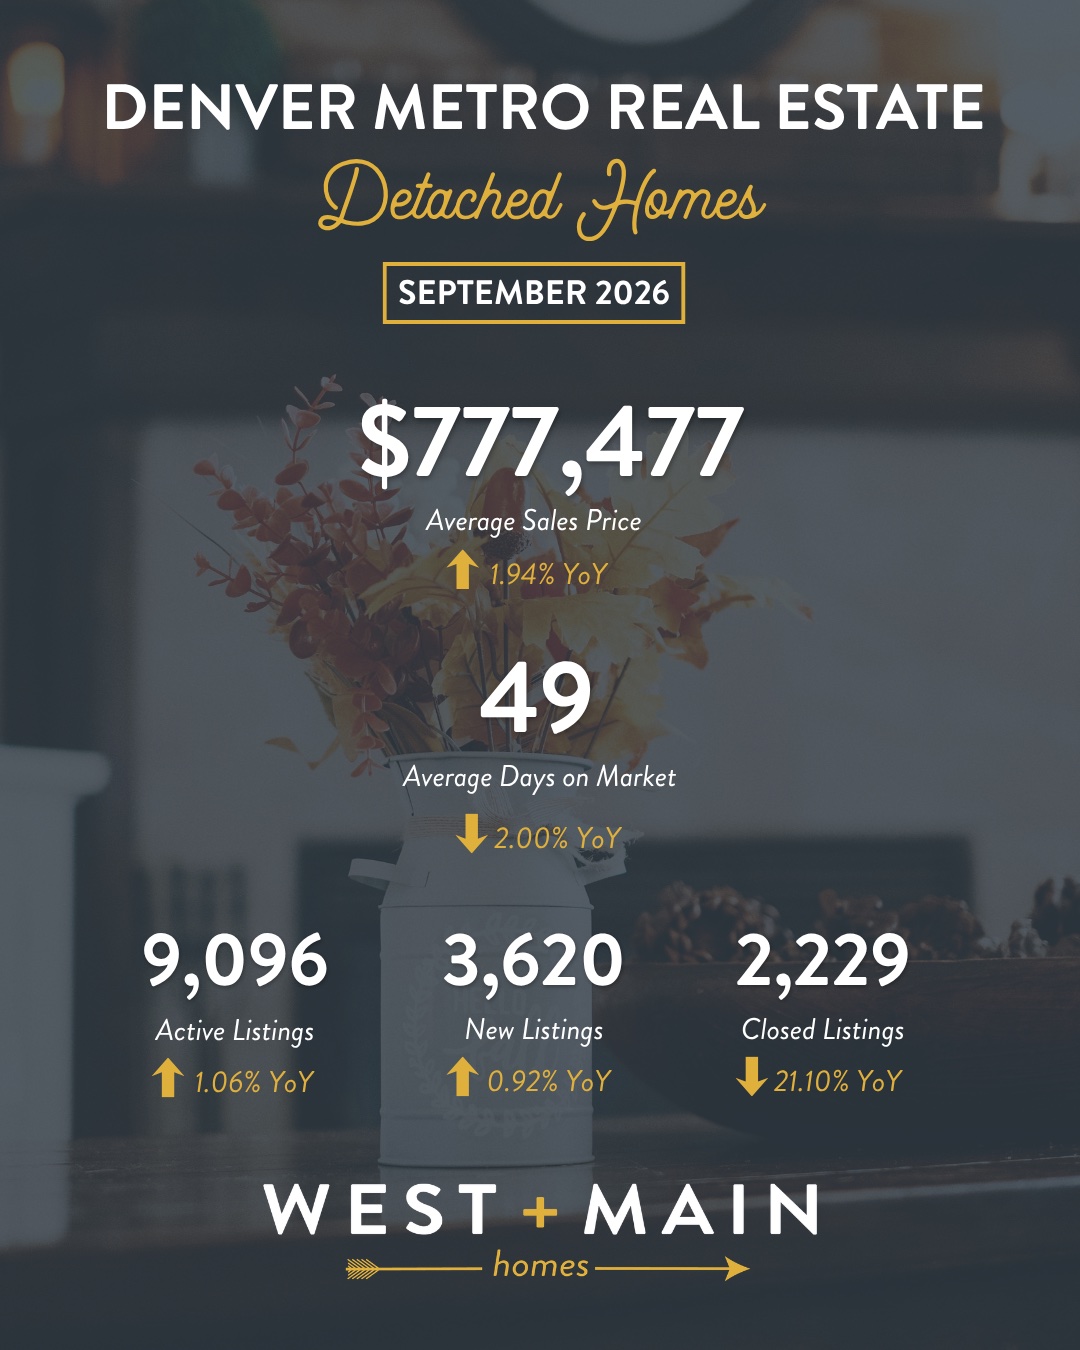
| Detached (Single-Family) | $777,477 | +1.94% | 49 days | -2.00% | 2,229 | -21.10% |
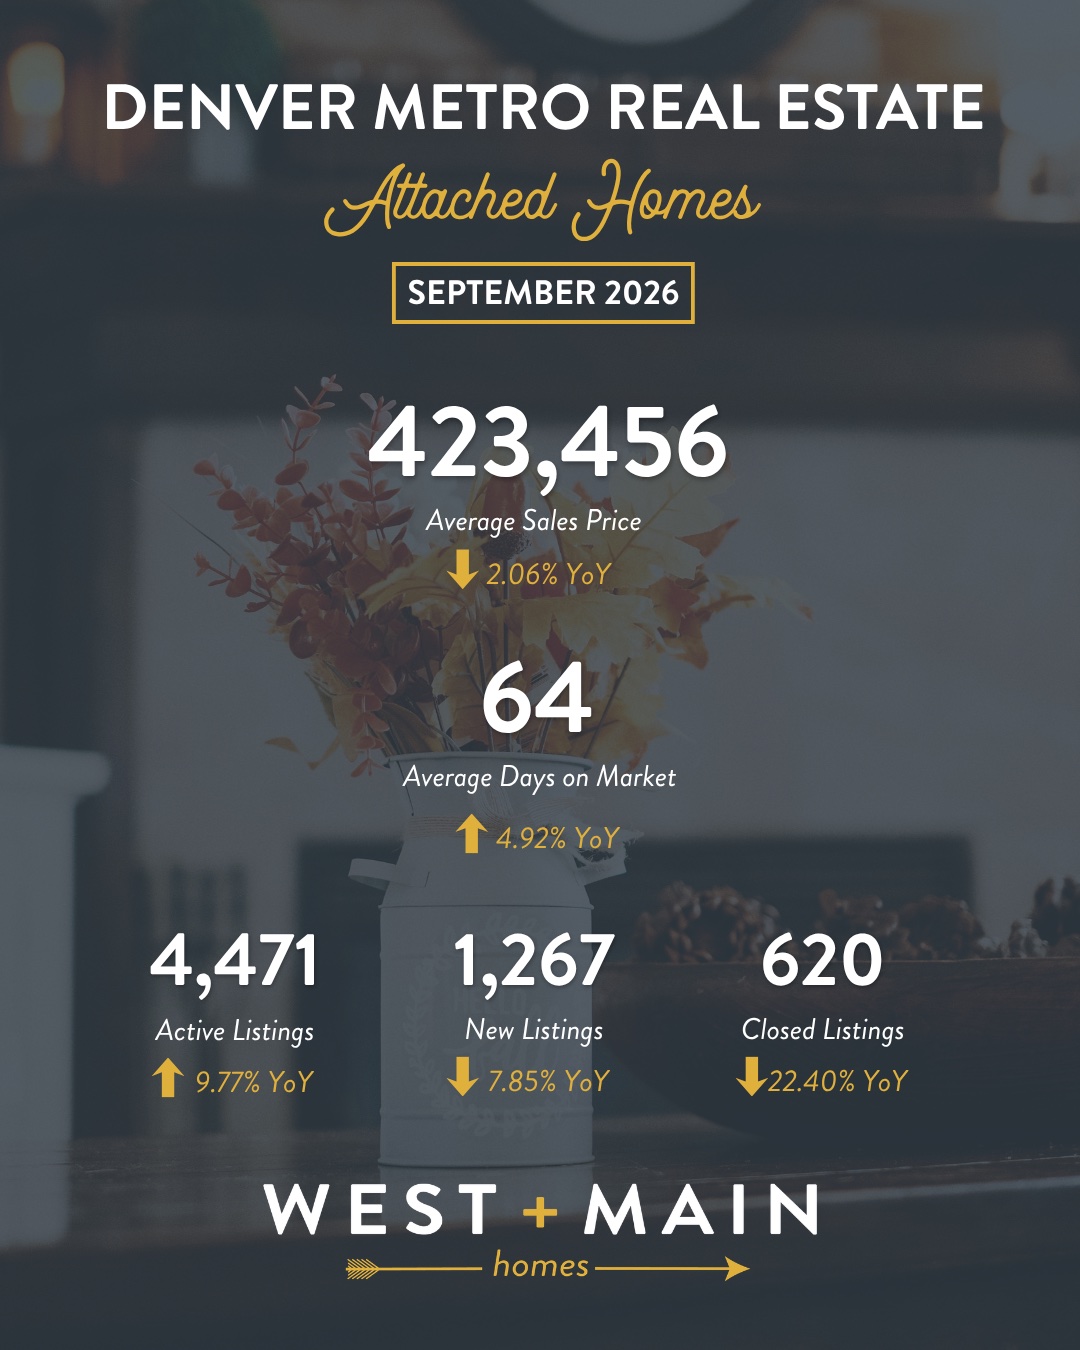
| Attached (Condo / Townhome) | $423,456 | -2.06% | 64 days | +4.92% | 620 | -22.40% |
| All Residential | $700,435 | +1.54% | 52 days | 0.00% | 2,849 | -21.39% |
What the Numbers Say
The headline is closed sales. 2,849 homes closed in September, down 21% from a year ago and the fewest September closings DMAR has on record going back to 2008.
Prices didn't follow. The average sale price is up 1.5% year-over-year, single-family homes averaged $777,477 (up 1.9%), and sellers are still getting about 98.5% of list price. Fewer homes are selling, but the ones that sell are selling at about the same price as last year.
The split by property type matters more than the overall number. Single-family homes are steady: prices up about 2%, days on market down slightly. Condos and townhomes are the soft spot: prices down, days on market up, and more than seven months of inventory. That's a buyer's market in that segment by any standard definition.
The Rate Story
September is when rates moved. The 30-year fixed climbed every week of the month and ended near 7.5%, and the Federal Reserve raised its benchmark rate for the first time since July 2023.
September's closings don't show that yet. Most of those homes went under contract in August, when rates were around 6.7%. The first real read is pending sales, which slipped 6% in September. October and November closings will show the full effect.
Here's what that move does to a monthly payment. On a $650,000 home with 10% down:
- At 6.7%, principal and interest runs about $3,775/month.
- At 7.5%, it's about $4,090/month.
That's roughly $315/month more for the same house, and none of it came from the price.
What I'm Seeing in My Own Deals
Of the four deals I worked in August and September (three buyers, one seller), three included a seller concession of $12,000 or more to buy down the buyer's interest rate.
That matches what DMAR is reporting at the metro level. The conversation has moved from "what's the price" to "how do we structure this." Rate buydowns and seller-paid concessions are standard parts of the negotiation right now, not a sign that something is wrong with the house.
What This Means for Buyers
You have more selection and more negotiating room than you've had in years, especially in condos and townhomes. Fourth quarter usually brings fewer competing buyers, since many wait until after the New Year.
Ask about concessions. With rates near 7.5%, a seller credit toward a buydown can do more for your monthly payment than a lower price. The right structure depends on how long you plan to keep the loan, so it's worth running the numbers with your lender before you write the offer.
What This Means for Sellers
Price for the payment, not just the price. Buyers are shopping at 7%+ rates, and the listings that sell are the ones that leave room for a concession or are priced so the buyer can make the monthly number work.
If you're selling a condo or townhome, give yourself time and price with HOA dues and insurance costs in mind. Buyers are comparing those monthly costs line by line.
NW Denver Micro-Market
Metro-wide numbers blend dozens of very different markets. For what's happening in Berkeley, the Highlands, LoHi, Sunnyside, or Sloan's Lake specifically, the useful data is block-by-block and property-type-specific.
For a current read on your specific neighborhood or property type, reach out directly.
This report draws from West + Main Homes brokerage data for the Greater Denver Metro MLS and the DMAR Market Trends Report for September 2026. Scot Conti is a Broker Associate with West + Main Homes, CO License #FA.100092023.
Want Reports in Your Inbox?
Subscribe to the Denver market note.
A short read on what's happening in Denver real estate. No spam, just data and perspective.